In an astonishing turn of events, an ancient Bitcoin whale has awakened from a slumber lasting nearly 15 years, transferring a staggering 3,962 BTC—valued at approximately $469 million—to a new wallet. This historical transaction was preceded by a small test move of merely 0.00184 BTC (around $218.59). Records show that the original wallet received this massive amount of Bitcoin back in January 2011, when the cryptocurrency was trading at a mere $0.37. To put this in perspective, the initial investment of just $1,453 has ballooned into a jaw-dropping fortune.
Update: This whale has transferred all 3,962 $BTC($468M) to a new wallet bc1qcz after being dormant for 14.5 years.https://t.co/GOp1mQk1Ihhttps://t.co/2vZYhjVCcp pic.twitter.com/Dv0N34Cj1g— Lookonchain (@lookonchain) July 24, 2025
The million-dollar question now circulating among market analysts and traders is: does this movement signify an impending sell-off, or is it merely a nostalgic maneuver by an early Bitcoin adopter? The implications of this transaction are significant, reflecting broader trends in the cryptocurrency market.
As Bitcoin consolidates below the $120,000 mark, analysts are observing increased selling pressure primarily from long-term holders—the archetypal “Bitcoin whales” who gathered their fortunes during the nascent days of crypto. It’s noteworthy to mention that just days earlier, another ancient Bitcoin whale liquidated their entire portfolio, amounting to 80,202 BTC, yielding around $9.53 billion. This pattern of profit-taking seems to be correlated with the recent price stabilization following Bitcoin’s impressive surge past $123,000.
Further analysis from Glassnode reveals that Bitcoin’s sharp ascent from $110,000 to $117,000 created what is termed an “on-chain air gap”—a low-density accumulation zone that can be critical for future movements. Historical data suggests that should current support falter, these gaps have the potential to evolve into bottom formation zones, raising the stakes for traders.
The sharp rally from $110k to $117k created an on-chain air gap or a low-density accumulation zone. Since the $122.6k ATH, price has held above it. If support fails, history shows such gaps can still evolve into bottom formation zones. pic.twitter.com/jEpXbwujwC— glassnode (@glassnode) July 24, 2025
While some whales appear to be liquidating their assets, institutional investors are stepping into the breach, actively purchasing Bitcoin during these price dips. For example, on July 24, investment giant BlackRock expanded its Bitcoin holdings by acquiring an additional 1,204 BTC, bringing its total to an impressive 737,000 BTC. Meanwhile, Michael Saylor’s Strategy has purchased an additional 4,225 BTC, elevating their reserves to 601,550 BTC. Other firms, including Metaplanet and Trump Media, have embraced Bitcoin treasury strategies, indicating a robust demand and strategic interest from influential players in the market.
Crypto analyst Ted Pillows remains optimistic amid this flurry of activity, noting the positive correlation between the U.S. stock market’s rally—which saw the S&P 500 reaching new heights—and Bitcoin’s potential trajectory. His prediction? BTC could soar beyond $130,000 in Q3 before facing any considerable corrections.
$BTC is still going sideways after hitting a new ATH. The good thing is that the US stock market is rallying, which means BTC could soon follow. IMO, $BTC is going above $130K in Q3 before any major correction. pic.twitter.com/o19qodSmop— Ted (@TedPillows) July 24, 2025
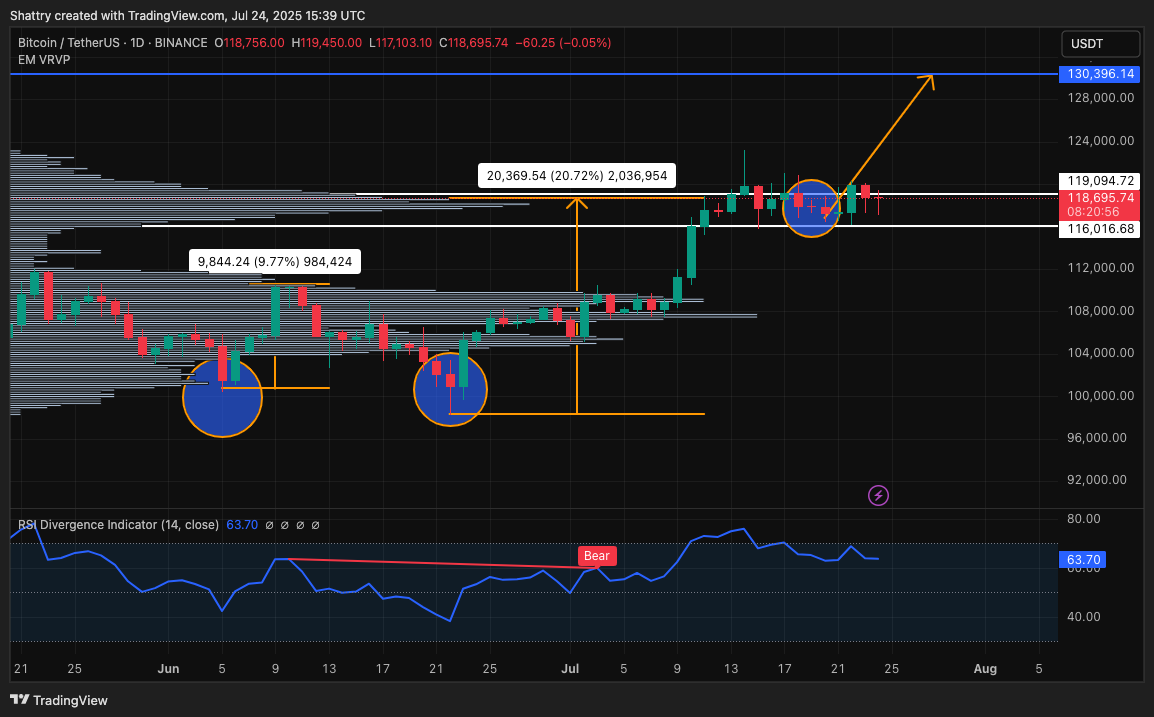
Turning to technical analysis, the BTC/USDT daily chart on Binance indicates that Bitcoin remains in a bullish market structure. June’s formation of two distinct double-bottom patterns led to subsequent upward movements, yielding significant gains of roughly 9.77% and 20.72%. These bullish reversals illustrate a strengthening conviction among buyers, as each bottom results in progressively higher highs, showcasing a robust demand.

At this juncture, Bitcoin is trading in a range between $116,000 and $119,000. This consolidation suggests the market is digesting the recent bullish rally. The Relative Strength Index (RSI) remains healthy at around 63.70, indicating that the asset is still in bullish territory. Additionally, the Volume Profile analysis reveals that significant liquidity is concentrated between $106,000 and $116,000, solidifying this area as a crucial support level. As the price continues to oscillate above $116,000, bullish sentiment remains intact.
The Bollinger Bands are squeezing on Bitcoin $BTC 4-hour chart. A volatility spike is imminent. A close outside the $117,000–$119,700 range will set the stage for the next big move. pic.twitter.com/UX0jd9Cf3I— Ali (@ali_charts) July 24, 2025
Should Bitcoin maintain its support in the $116,000 to $119,000 range, a breakout could target the $130,396 resistance level—a key milestone on an upward trajectory. Conversely, a failure to hold above this vital support might see Bitcoin retesting the $112,000 mark; however, even in such a scenario, the overall bullish structure is expected to remain resilient.
The awakening of this ancient Bitcoin whale speaks volumes about the evolving landscape of cryptocurrency and the psychological dynamics of market participants. As we navigate this exciting chapter in Bitcoin’s history, all eyes will remain glued to market movements, institutional strategies, and the whispers of both bullish and bearish sentiments that could shape the future of this revolutionary digital asset.
For continued insights and analysis on cryptocurrency trends, don’t forget to follow our updates, and consider engaging with the broader community through discussions on platforms like [Reddit](https://www.reddit.com/r/cryptocurrency/) or [Twitter](https://twitter.com/). Your thoughts and insights are always welcome!
