Crypto Market Sees Slight Decline After Initial Upsurge: What’s Next?
In a surprising twist, the cryptocurrency market, after showing promising upward momentum for a few hours, has slumped back into the red. Almost all the top 100 cryptocurrencies have witnessed a dip in their prices over the past 24 hours, leaving investors wondering about the next move. As of now, the overall market capitalization has contracted by 3%, landing at a staggering $3.41 trillion, while total trading volume stands at $89 billion—well below the usual activity levels.
📌 Why This Matters
This downturn is more than just a number; it’s indicative of the sensitive nature of the crypto market, particularly following Bitcoin (BTC) hitting near all-time highs. Understanding these fluctuations is crucial for investors who want to navigate the volatility effectively. The current bearish sentiment is a sharp reminder that despite high expectations, cryptocurrencies can change course unexpectedly.
🔥 Brief Overview of Market Movements
As we break down the performances of major coins, it’s clear that the bears have taken the reins. Bitcoin has dropped by 0.7%, settling at $104,737. Similarly, Ethereum (ETH) has experienced an insignificantly small gain of 0.5%, but that’s not enough to stave off a loss, currently trading at $2,614. Remarkably, the only coin in the top ten that managed to secure a positive result is Tron (TRX), which climbed by 1.7% to $0.2731. On the other end, Dogecoin (DOGE) saw the steepest decline, plummeting 3.5% to $0.1892.

The Winners and Losers of the Day
It’s striking to note that among the top 100 cryptocurrencies, only five recorded price increases during this timeframe. Tron stands out again as the top performer, accompanied by Tokenize Xchange (TKX), which rose 0.9% to $31.37. Conversely, Monero (XMR) suffered the greatest setback, plummeting by 8.1% to $318. This scenario reinforces the ongoing volatility and competitive nature of the market.
Expert Insights on Market Dynamics
According to market analytics firm Glassnode, the upward push toward Bitcoin’s all-time high (ATH) has hit a snag due to increasing resistance. The data reveals signs of buyer exhaustion combined with profit-taking from long-standing holders. In essence, many key accumulation zones from previous bullish cycles are transforming into active selling zones.
“After briefly leaning toward distribution, the largest $BTC holders are now back in accumulation,” noted the firm, underscoring the market’s ever-changing landscape.
🚀 Future Outlook: Where Is Bitcoin Headed?
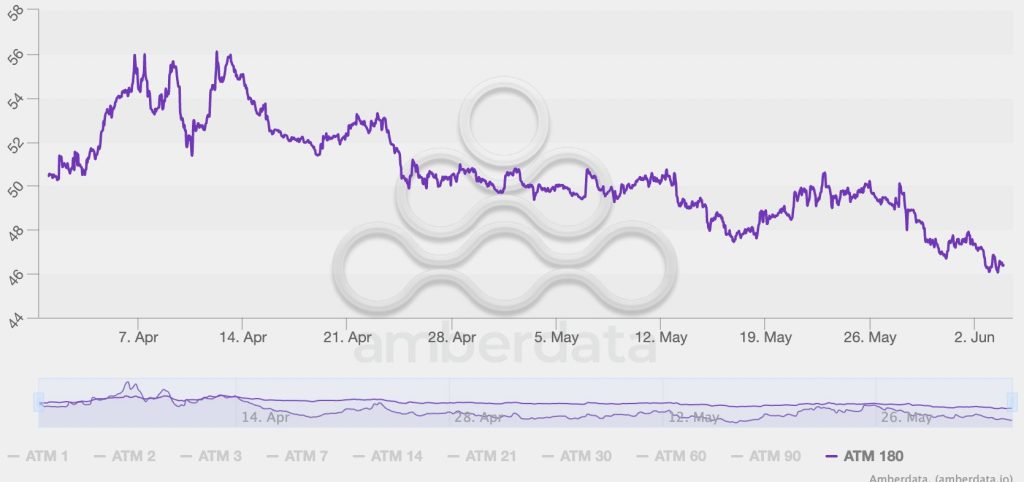
Looking ahead, Nick Forster, the founder of the decentralized on-chain options platform Derive.xyz, suggests that Bitcoin may face challenges in surpassing the $110,000 mark due to current market dynamics. According to him, market makers are in a short gamma, creating a feedback loop of demand. Yet at $110,000, they become gamma-neutral, making further upward movement unlikely.
The likelihood of Bitcoin hitting $125,000 by the end of September sits at 11%, decreased from 18% just a week ago. Such changes highlight the market’s volatility and the chilling effect of lower implied volatility, which compresses potential price swings.
Current Trading Levels to Monitor
Bitcoin’s recent performance shows it hovering at $104,737; notably struggling to maintain the critical $105,000 level. The intraday high reached $105,910, but the asset then retreated. Currently, it remains down 6.1% from its ATH of $111,814. Ethereum has felt the strain too, having peaked at $2,667 but now faces a 4.3% drop over the week.
The Fear and Greed Index Signals Caution
The crypto market’s overall sentiment is reflected in the Fear and Greed Index, which has sunk deeper into the neutral range, indicating a growing bearish outlook at 55. Just days prior, it soared to extreme greed at 76, coinciding with Bitcoin reaching its recent ATH. This oscillation presents a cautionary tale for investors as market sentiment can pivot based on external factors and the behavior of major holders.
Spot ETF Inflows: A Silver Lining?
A recent influx of investors into U.S. spot Bitcoin ETFs has provided a glimmer of hope, with net inflows of $86.92 million reported for a second consecutive day. This stands in stark contrast to the outflow trend witnessed earlier. However, even as Bitcoin funds experience ups and downs—such as BlackRock witnessing inflows of nearly $284 million while Fidelity faced outflows—it’s essential to recognize the underlying market challenges.
Quick FAQ: Your Crypto Questions Answered
Why did crypto move against stocks today?
The decline in the crypto market coincides with a mixed performance among US stock markets. While the S&P 500 saw a slight uptick, the Dow Jones experienced a dip. This divergence in movement highlights the unique factors influencing each asset class, including Trump’s renewed advocacy for a Federal Reserve interest rate cut.
Is this dip sustainable?
Analysts posit that this recent downturn may be part of a standard post-ATH correction. Yet, with the market’s heightened sensitivity to macroeconomic factors, it’s crucial for investors to stay alert. The current environment is rife with uncertainty, where short-term dips can quickly transition into more prolonged bearish trends if broader economic indicators shift.
Conclusion: What Lies Ahead in Crypto?
The crypto market’s current state serves as a reminder of its unpredictable nature. As prices oscillate and sentiment shifts, investors must remain vigilant and informed. Will Bitcoin manage to breach resistance levels, or will current pressures lead to prolonged declines? Join the conversation and share your thoughts—what strategies are you employing in this fluctuating market?

