Bitcoin Signals Early Reversal: What Does It Mean for Traders?
Bitcoin is showing early signs of a possible trend reversal, currently trading at around $83,780, which reflects a 1.5% increase during the day. This subtle shift in momentum has captured the attention of technical analysts, who are keenly watching the development of a “W-bottom” formation, famously identified by John Bollinger, the creator of Bollinger Bands.
Classic Bollinger Band W bottom setting up in $BTCUSD. Still needs confirmation. https://t.co/v1qfBbEoDV Remember: The fraudsters are legion. I will never ask you for anything. #BollingerBands #btc— John Bollinger (@bbands) April 10, 2025
In a recent TradingView post on April 10, Bollinger illustrated this potential reversal pattern on the weekly BTC/USD chart, emphasizing the necessity for confirmation before traders could act confidently. He noted: “Classic Bollinger Band W bottom setting up in $BTCUSD. Still needs confirmation.”
The Technical Picture: Support and Resistance Levels
On the weekly charts, Bitcoin briefly dipped below the lower Bollinger Band before bouncing back above the crucial support level of $70,000. This price action is often associated with potential trend reversals. To solidify this bullish outlook, Bitcoin must close above its 20-week simple moving average, currently sitting at approximately $84,000.
#BTC forming a “classic” bottom near $80K, says #Bollinger. A bullish “W” pattern hints at reversal, though confirmation is still lacking. $70K remains a key support zone. pic.twitter.com/PsV5r7cIlR— Bitcoin info (@Btc_i1) April 11, 2025
Market analysts are keeping a close eye on Bitcoin’s performance around the $70,000 mark, which is not only a psychological barrier but a key liquidity level. Timothy Peterson’s “Lowest Price Forward” model had previously indicated a 95% likelihood of this support holding, but the changing macroeconomic landscape warrants a more cautious approach.
Correlation with Broader Market Dynamics
Despite the optimistic technical indicators, broader market sentiment remains somewhat mixed. Bitcoin has been closely following trends in U.S. equities, particularly the Nasdaq 100 and S&P 500. Jurrien Timmer from Fidelity observed that the S&P recently oscillated from two standard deviations above its trend to two below — a sign that could indicate oversold conditions but may not yet confirm a reversal.
Adding to the cautious sentiment, Timothy Peterson explains that Bitcoin historically tends to lead during market downturns but often lags in recoveries. For any sustainable upward movement in Bitcoin, a significant shift toward risk-on behavior in stock markets is essential, coupled with signs that macroeconomic headwinds like interest rate volatility are beginning to stabilize.
Breaking Key Resistance: What’s Next for Bitcoin?
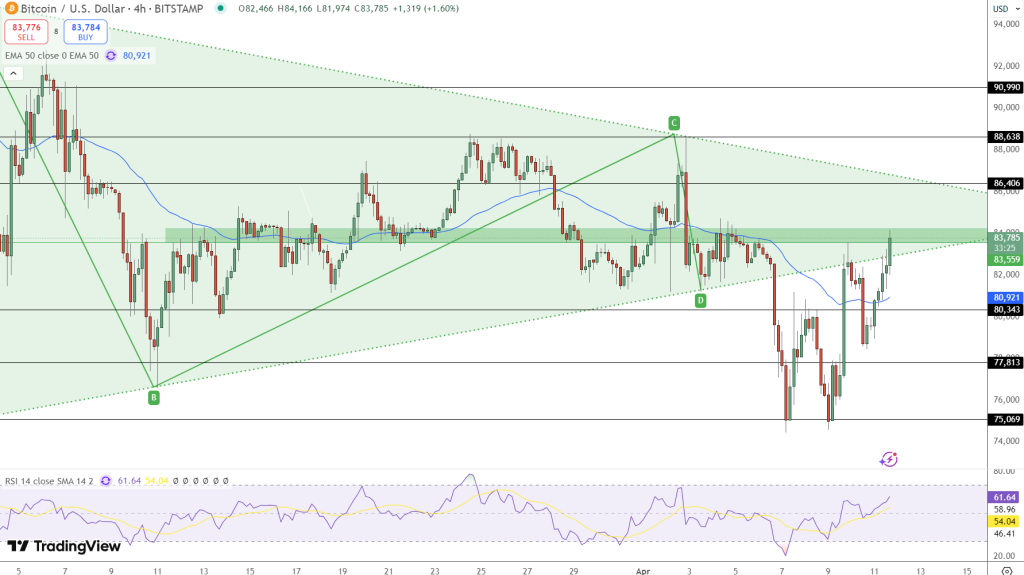
As Bitcoin trades near $83,780 after breaking the key resistance level of $83,560, a clearer bullish momentum is emerging. This movement aligns with a decisive breach of the 50-day exponential moving average (EMA) at approximately $80,920, which indicates positive market sentiment.

The relative strength index (RSI) is currently around 62, indicating that there may be additional room for upside momentum before reaching overbought conditions. Should buyers continue to maintain control, the next resistance targets are set at $86,400 and $88,600. Moreover, a retest of $83,560 could provide essential support confirmation for bullish traders.
Key Analysis Summary
- Support Levels: $80,900 (50 EMA), $80,000, $77,800
- Resistance Targets: $83,560 (now broken), $86,400, $88,600
- Current Momentum Indicator: RSI at 62 – indicating bullish, not yet overbought
- Breakout Trigger: A confirmed close above $84,000 could ignite momentum toward $91,000
The short-term trend for Bitcoin remains bullish after reclaiming the crucial 50-day EMA and breaking above the triangular resistance at $83,560. However, price action around $84,000 — which represents both a mid-Bollinger band and psychological level — will be pivotal in confirming the bullish reversal that Bollinger has highlighted.
Conclusion: The Horizon Ahead
As Bitcoin approaches this critical technical juncture, the implications of a confirmed W-bottom pattern could signal a favorable trajectory towards $86.4K and $88.6K. With macroeconomic sentiment showing signs of stabilization and John Bollinger flagging this classic setup, traders and investors alike are zeroing in on this crucial resistance level.
BTC Bull: Passive Income and Strategic Investment
Notably, BTC Bull ($BTCBULL) is currently making waves as one of the most exciting presales in the crypto sphere, blending meme culture with tangible utility. This token not only rewards holders with real Bitcoin as BTC reaches price milestones but also champions long-term investment strategies.
With a staking program boasting an impressive 119% annual percentage yield (APY), BTC Bull allows users to earn passive income while contributing to the network’s growth. As of now, over 882.5 million BTCBULL tokens have already been staked, underscoring the growing community engagement and enthusiasm.

Latest Presale Updates
- Current Token Price: $0.002455 per BTCBULL
- Amount Raised: $4.5M out of a $5.23M goal
With time running out and demand surging, now is a critical moment to secure BTCBULL at presale prices before the next price increase. Are you ready to capitalize on the budding potential of Bitcoin and its innovative companions? Join the conversation and share your thoughts below!

