In the exciting world of cryptocurrency, seismic events often occur in the blink of an eye, and one such moment has recently gripped the attention of Bitcoin enthusiasts. An ancient Bitcoin whale, who has been silent for a staggering 14 years, has re-emerged, transferring a jaw-dropping 3,962 BTC—valued at approximately $469 million. This action wasn’t random; it followed a test transaction of merely 0.00184 BTC (worth about $218.59) to signal that a significant movement was brewing in the shadows.
Update: This whale has transferred all 3,962 $BTC($468M) to a new wallet bc1qcz after being dormant for 14.5 years. https://t.co/GOp1mQk1Ih https://t.co/2vZYhjVCcp
Delving deeper into the history of this wallet reveals an interesting backstory. It first surfaced in January 2011 when Bitcoin was trading at a mere $0.37. Back then, the initial investment was a mere $1,453—a wild contrast to the current valuation. Such a staggering return on investment is a testament to the monumental journey of Bitcoin itself.
So, why does this event matter? Market analysts are scrutinizing the implications of this transaction with bated breath. Does this large-scale transfer signify a potential sell-off, or is it merely a strategic move in portfolio management from a bygone era of Bitcoin? This question looms large as market dynamics shift, forcing observers to carefully decipher the motivations behind these ancient wallets.
The specter of this whale’s activity is all the more intriguing when we consider the broader landscape of Bitcoin’s recent market movements. Just days before this transfer, another ancient whale liquidated their full holdings of 80,202 BTC after 14 years, netting a staggering $9.53 billion. Such occurrences create ripples in the market, leading many to speculate about the increased selling pressure from long-term holders, particularly as Bitcoin has established new all-time highs above $123,000.
Glassnode’s analysis indicates that Bitcoin’s dramatic surge from around $110,000 to over $117,000 has created what’s known as an “on-chain air gap,” a low-density area of accumulation. In layman’s terms, this could be a precarious situation; if support fails to hold, it could lead to significant price adjustments. Historical trends suggest that such gaps often transition to bottom formation zones, raising the stakes for traders.
The sharp rally from $110k to $117k created an on-chain air gap or a low-density accumulation zone. Since the $122.6k ATH, price has held above it. If support fails, history shows such gaps can still evolve into bottom formation zones.
Yet, while older investors may be re-evaluating their positions, a contrasting force is evident—those savvy institutional players are navigating through these fluctuations actively. Recently, BlackRock bolstered its Bitcoin holdings, acquiring 1,204 BTC, thereby elevating their total stash to an astounding 737,000 BTC. More players like Michael Saylor’s strategy have also stepped into the fray, acquiring 4,225 BTC, which raises their overall reserves to 601,550 BTC. Other companies—ranging from Swedish gaming firms to Japanese AI enterprises—have also adopted aggressive Bitcoin treasury strategies, reflecting growing institutional confidence in Bitcoin’s future.
🔥
The optimism doesn’t stop there. Crypto analyst Ted Pillows believes the U.S. stock market’s current rally—highlighted by the S&P 500 reaching new pinnacles—could provide much-needed momentum for Bitcoin. He boldly predicts that Bitcoin could soar past the $130,000 mark in Q3 before encountering any substantial corrections.
$BTC is still going sideways after hitting a new ATH. The good thing is that the US stock market is rallying, which means BTC could soon follow. IMO, $BTC is going above $130K in Q3 before any major correction.
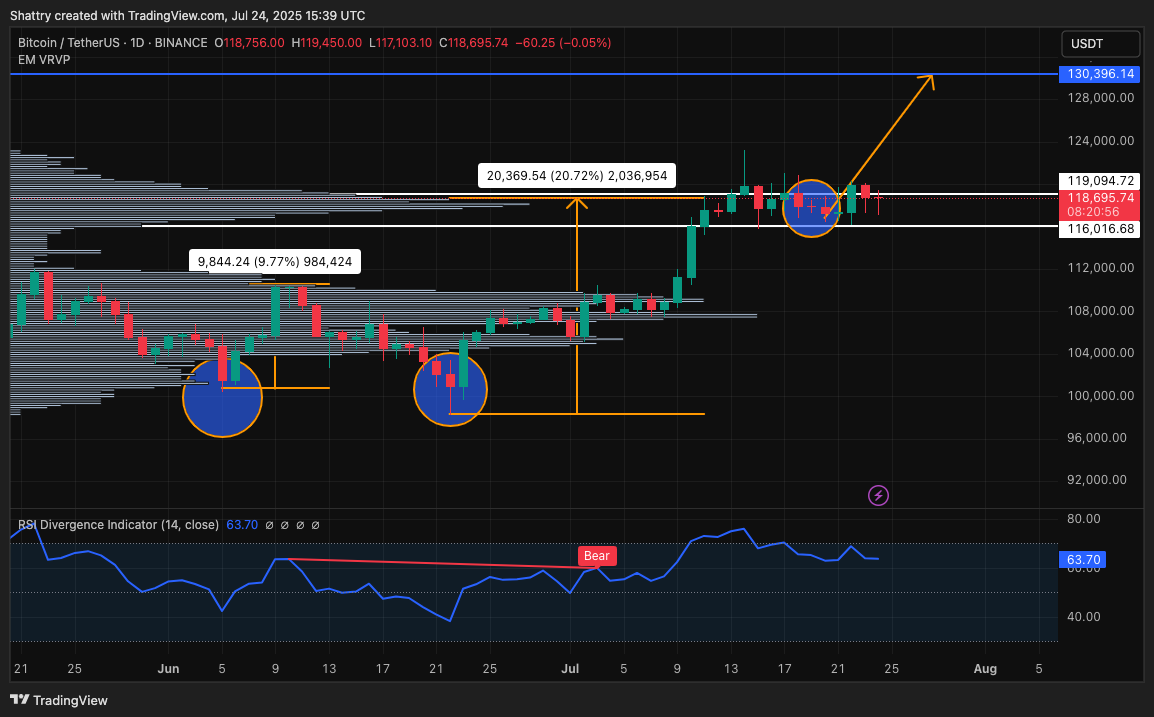
Analyzing the technical landscape offers further insights into Bitcoin’s potential trajectory. The daily BTC/USDT chart from Binance showcases a bullish market structure with distinct double-bottom formations indicating a robust support system following recent rallies. These movements, generating impressive gains, contribute to a general sense of increased buyer confidence and renew optimism in the market.

Currently, Bitcoin is navigating through a price range of $116,000 to $119,000, following the recent rally, showcasing clear absorption around this level. This period of sideways movement hints at a potential opportunities for patient traders to accumulate. The Relative Strength Index (RSI) remains comfortably above the neutral level, which suggests that bullish momentum is still alive and well.
The Bollinger Bands are squeezing on Bitcoin $BTC 4-hour chart. A volatility spike is imminent. A close outside the $117,000–$119,700 range will set the stage for the next big move.
Looking ahead, if Bitcoin can maintain support in the $116,000-$119,000 corridor, a breakout could very well aim for the tantalizing target of $130,396. On the flip side, should it falter, a retest of the $112,000 area might be on the horizon. However, technical analysis suggests that the overall bullish structure remains intact, setting the stage for potential upward movements in the near future.
As the tides of the cryptocurrency market continue to shift, one thing is clear: the ever-watchful eye on Bitcoin will unveil not just its fate, but also that of the broader crypto ecosystem. Whether you’re a seasoned trader or a newcomer, staying informed and engaged has never been more essential. Will you be ready to seize the opportunity?
